UPDATE reporting SET manual_effort = manual_effort * 0.3;
→ ~70% less manual effort · 10–15 hrs saved weekly
Analytics & Digital Transformation · New Delhi
Aakash Singh Dahiya
I turn complex business problems into decisions people can act on.
The work, in numbers.
0+
Compliance obligations digitized
~0%
Manual reporting effort reduced
0–0
Hours saved every week
0.0+
Years turning data into decisions
~0
Active users on the compliance platform I built
0+
Collection sites tracked on the field platform
01 / The raw data
Every project starts as noise.
Department-owned spreadsheets, ERP exports, field reports on paper, compliance records in ten different formats. My work begins where the mess is worst.
02 / Making it trustworthy
I make it dependable.
Validation, standard definitions, and platforms instead of files — 500+ compliance obligations digitized across 10+ departments, with data everyone can agree on.
03 / The signal
Then the signal appears.
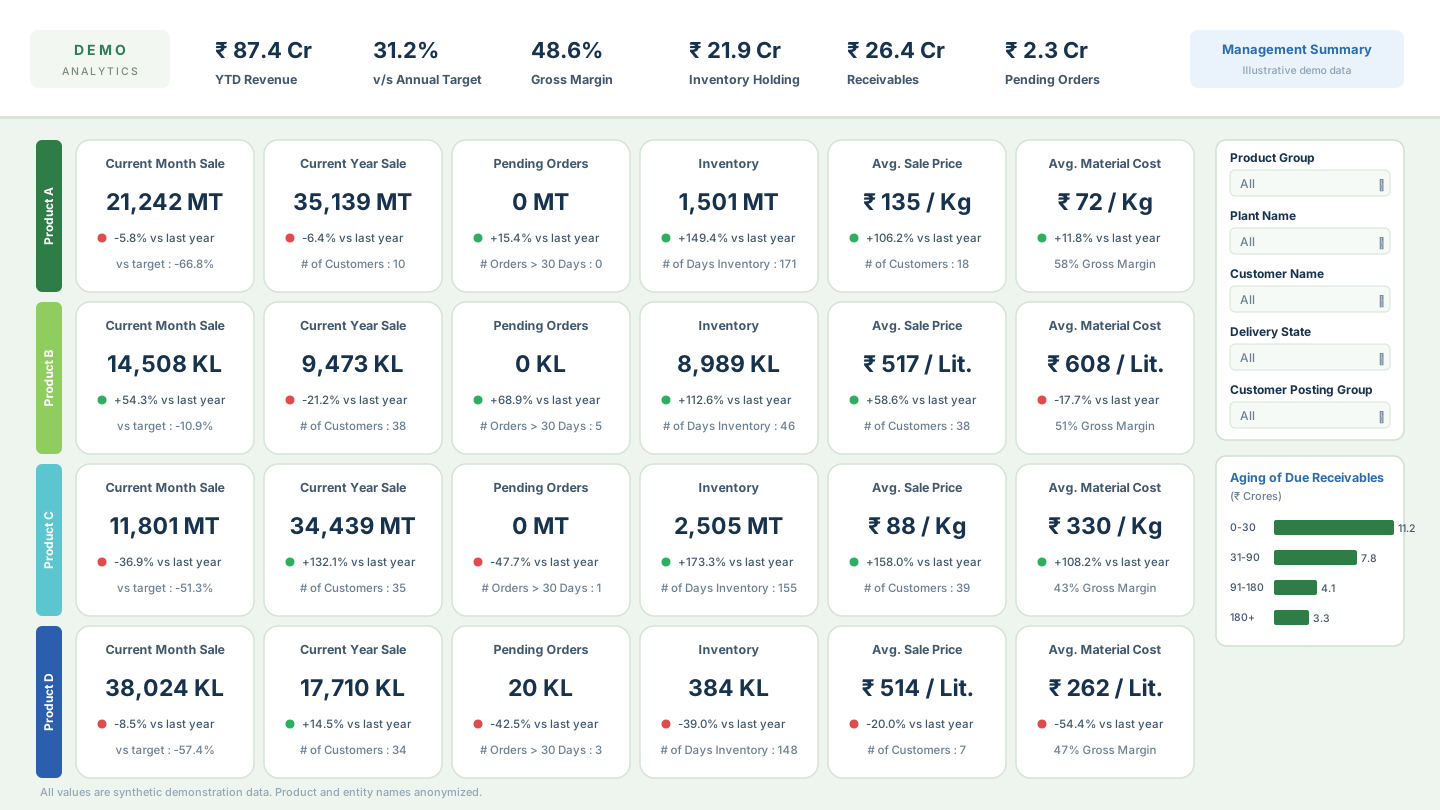
Executive dashboards across sales, inventory, receivables and procurement — the patterns leadership couldn't see across separate files, on one screen.
04 / The decision
And it drives a decision.
Management reviews run on these systems — ~70% less manual reporting effort, 10–15 hours saved weekly, and decisions made from evidence instead of assembly.
What I Build
Five areas where business problems become working systems
Analytics & Business Intelligence
Executive dashboards, MIS and KPI systems that give leadership one place to see how the business is performing.
Data & Decision Systems
Turning fragmented reporting into structured, decision-ready analysis leadership can act on directly.
Automation & Digital Transformation
Digitizing manual processes and building internal platforms that replace spreadsheet-based workflows.
AI & Intelligent Solutions
Using AI-assisted development to prototype and ship business tools quickly, while owning the problem, requirements and outcome myself.
Field & Operational Intelligence
Extending analytics into field operations — crop monitoring, remote sensing and platforms built for people working outside an office.
Selected Enterprise Work
Real systems, shipped and in active use
Consulting-style case studies — business problem, my contribution, technology, and measured outcome.
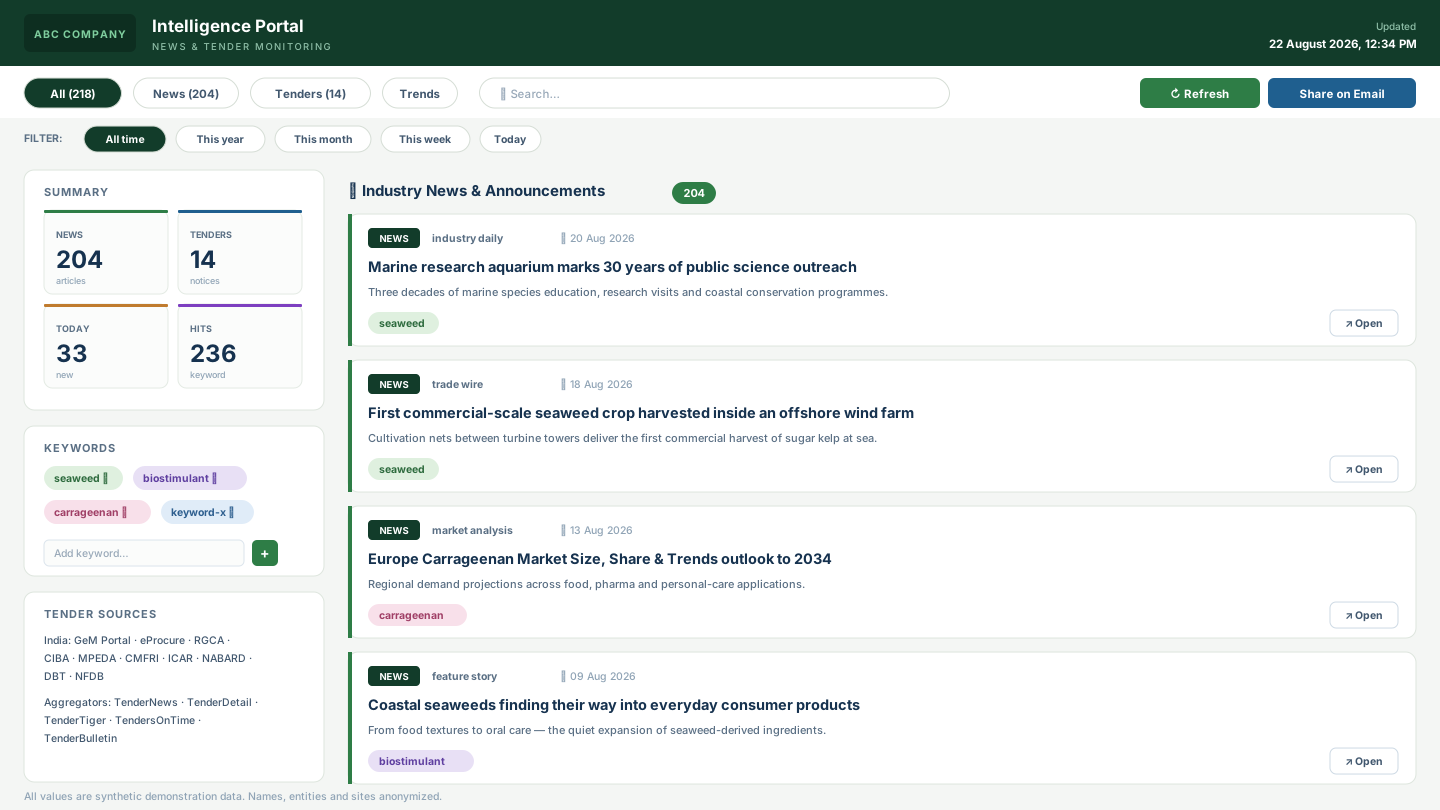
News & Tender Intelligence Portal
An internal intelligence portal that automates news and tender monitoring for R&D and Marketing, replacing fragmented manual searches with a centralized, keyword-driven workflow.
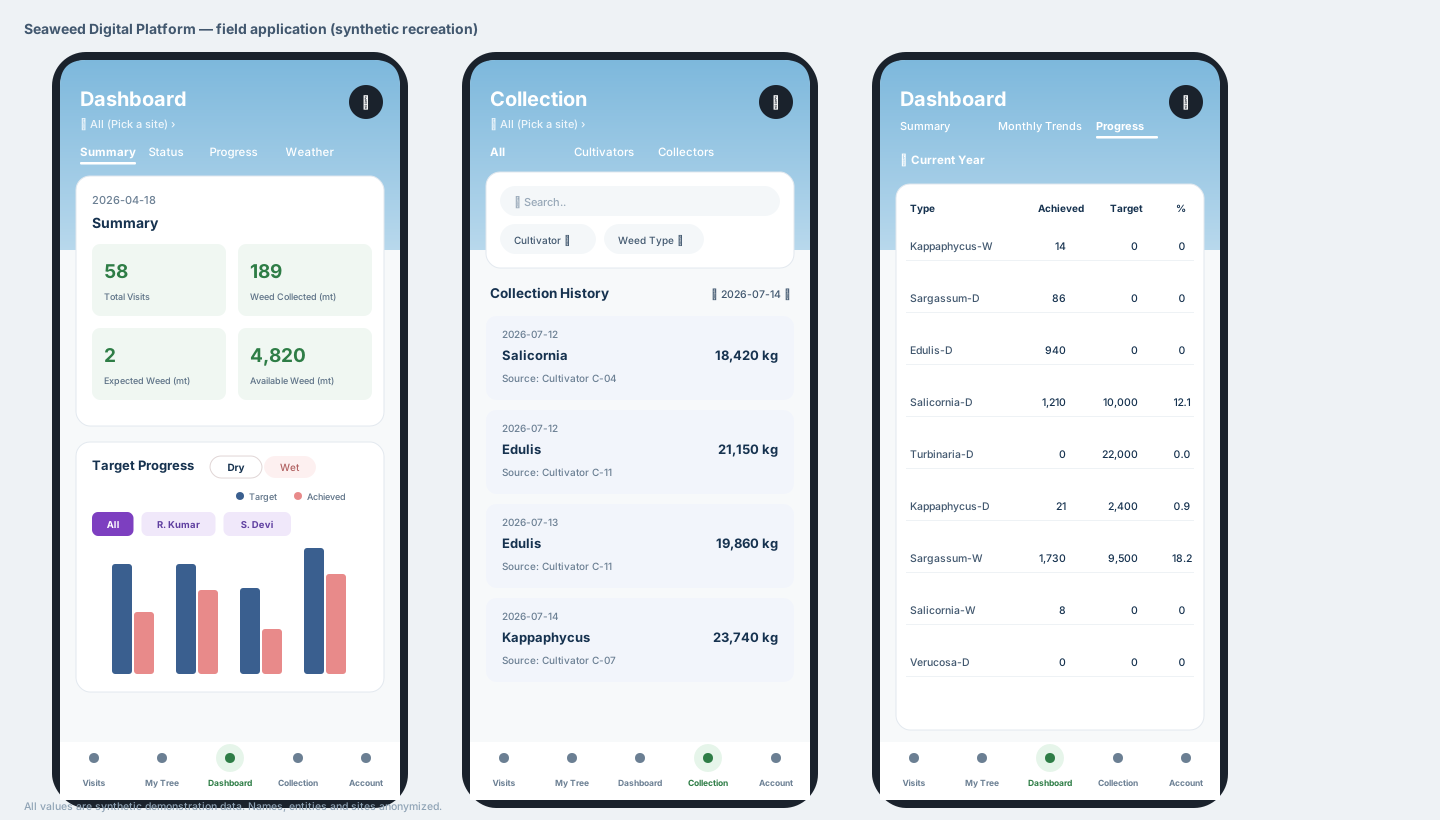
Seaweed Digital Platform
A mobile-first field platform digitizing seaweed collection operations across 30+ coastal sites — offline-first collection capture, field hierarchy, species-wise targets and daily operational visibility. Vendor-developed; I own it functionally end to end.
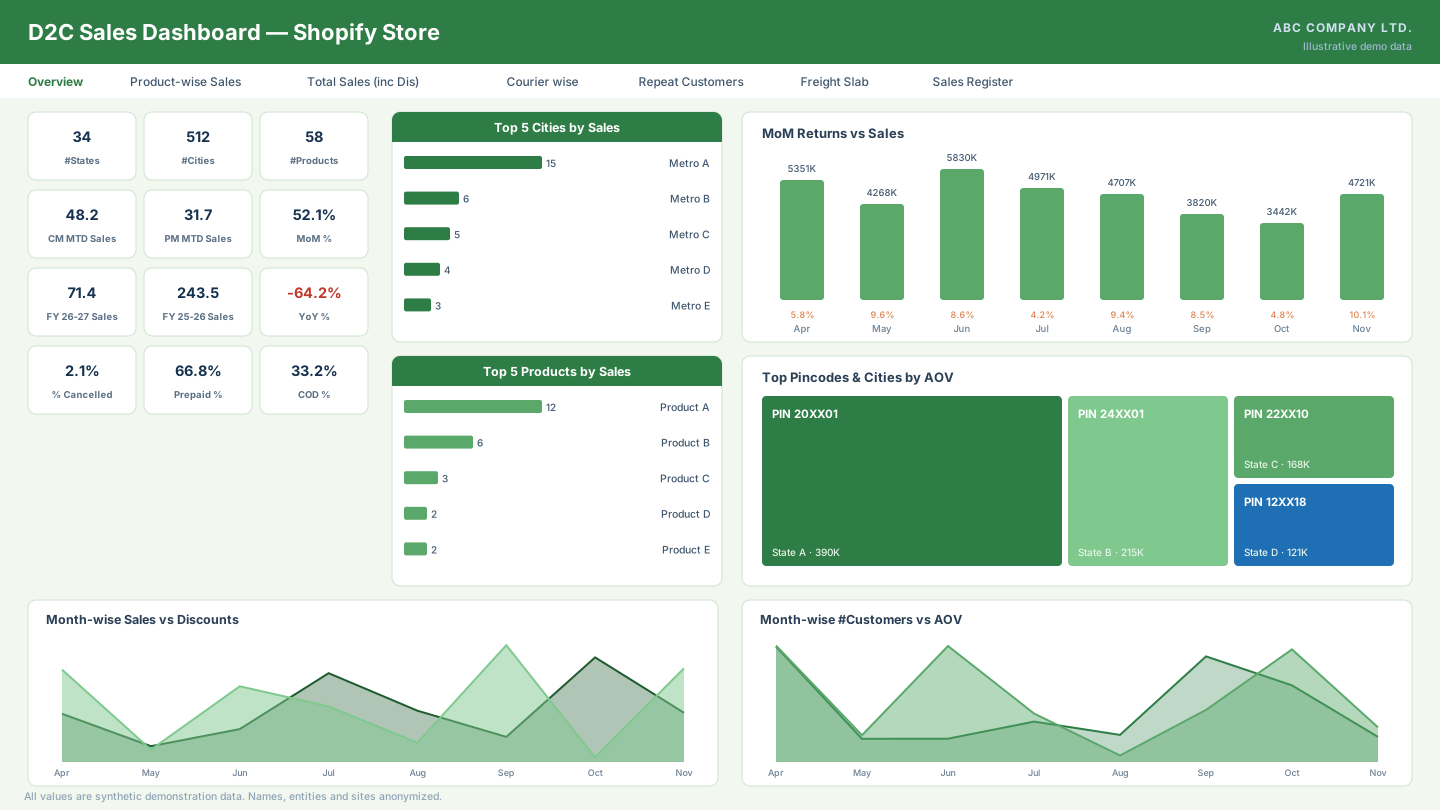
D2C E-commerce Analytics — Shopify Store
A Power BI analytics suite for a direct-to-consumer e-commerce operation — covering sales performance, courier and freight behaviour, and repeat-customer analysis across financial years.
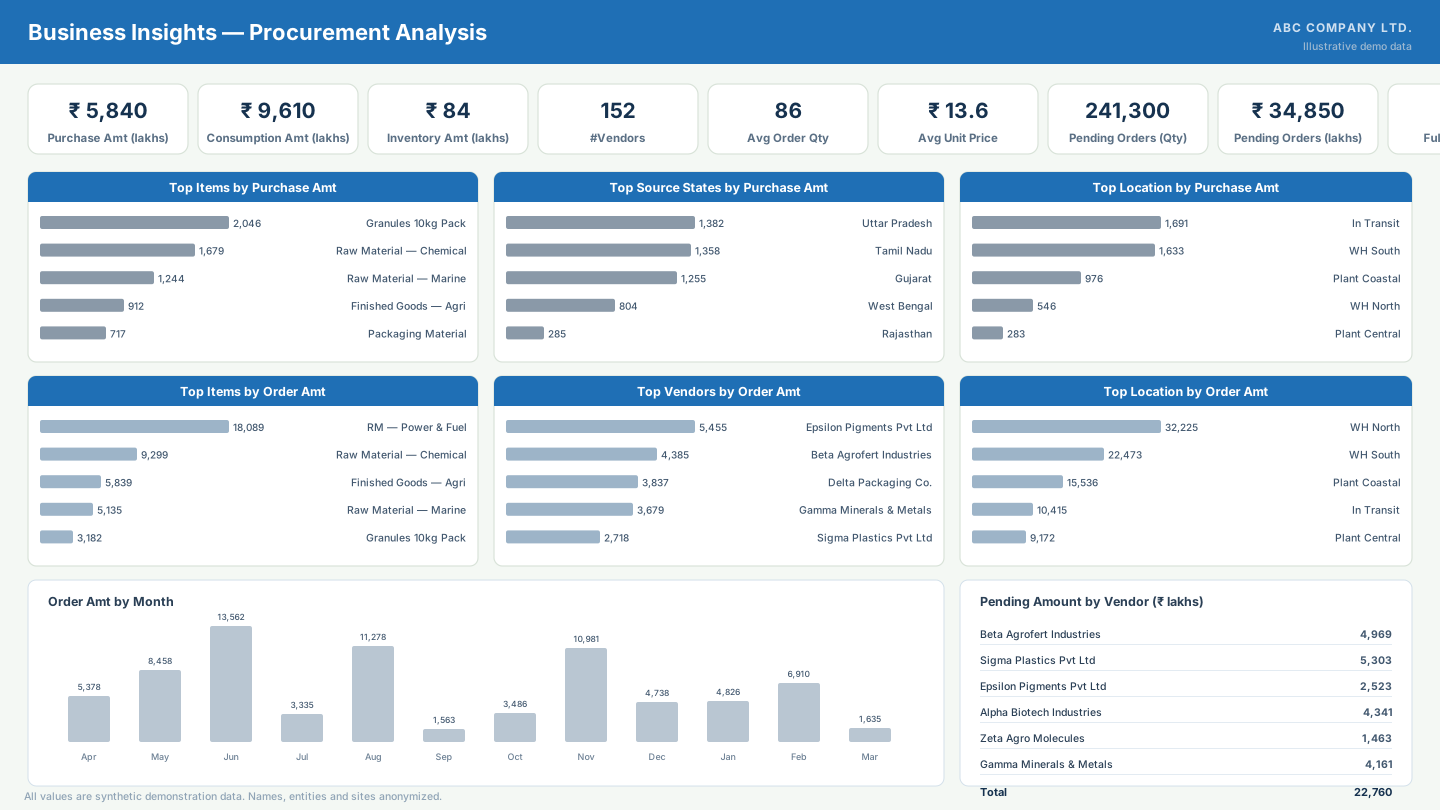
Procurement Insights Suite
A four-page Power BI suite giving root-level visibility into procurement — spend, vendors, items, pending orders and inventory movement — built to answer where procurement money actually goes.
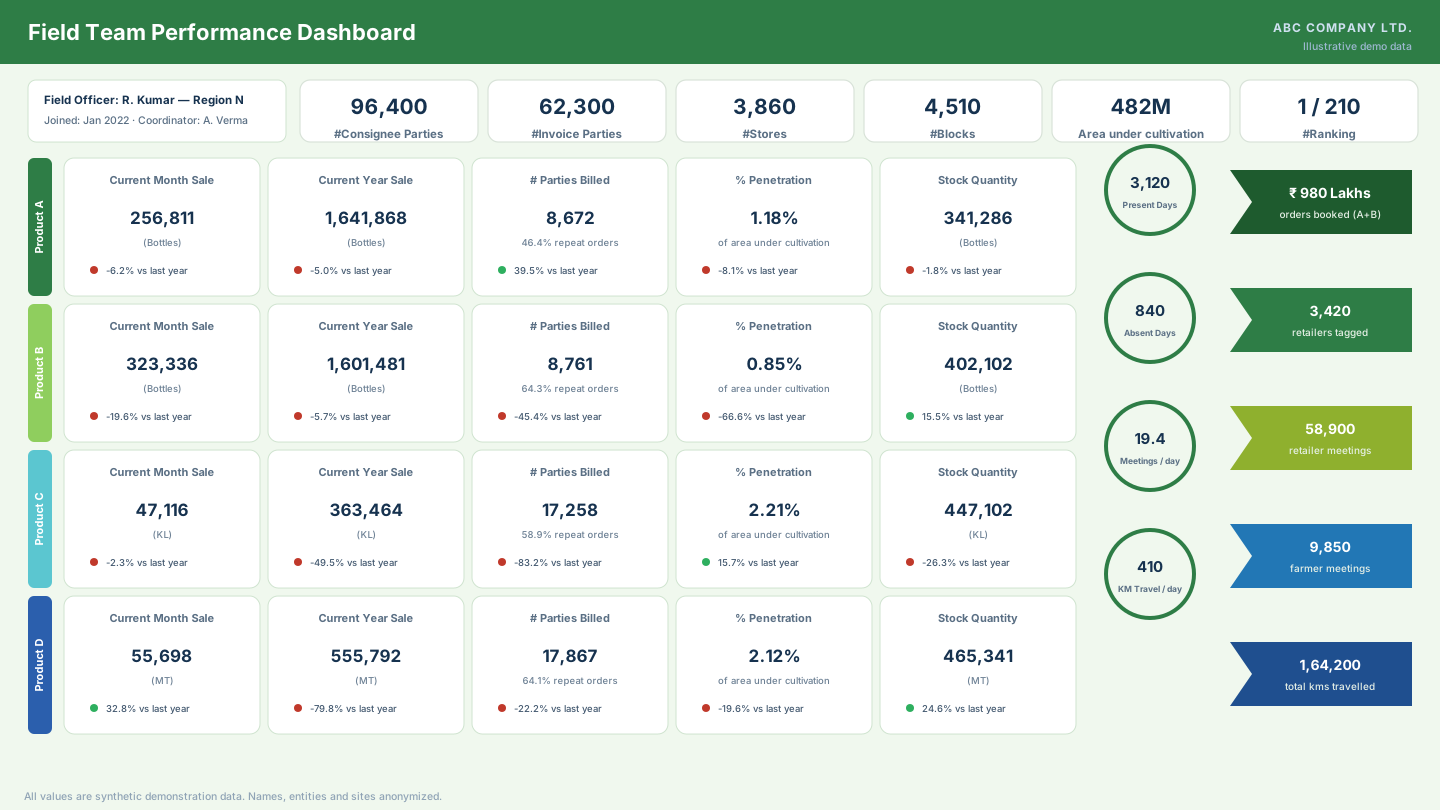
Field Team Performance Dashboard
A per-officer Power BI dashboard for a large field sales organization — product-wise sales, market penetration, activity levels and rankings, designed so every field officer can self-monitor.
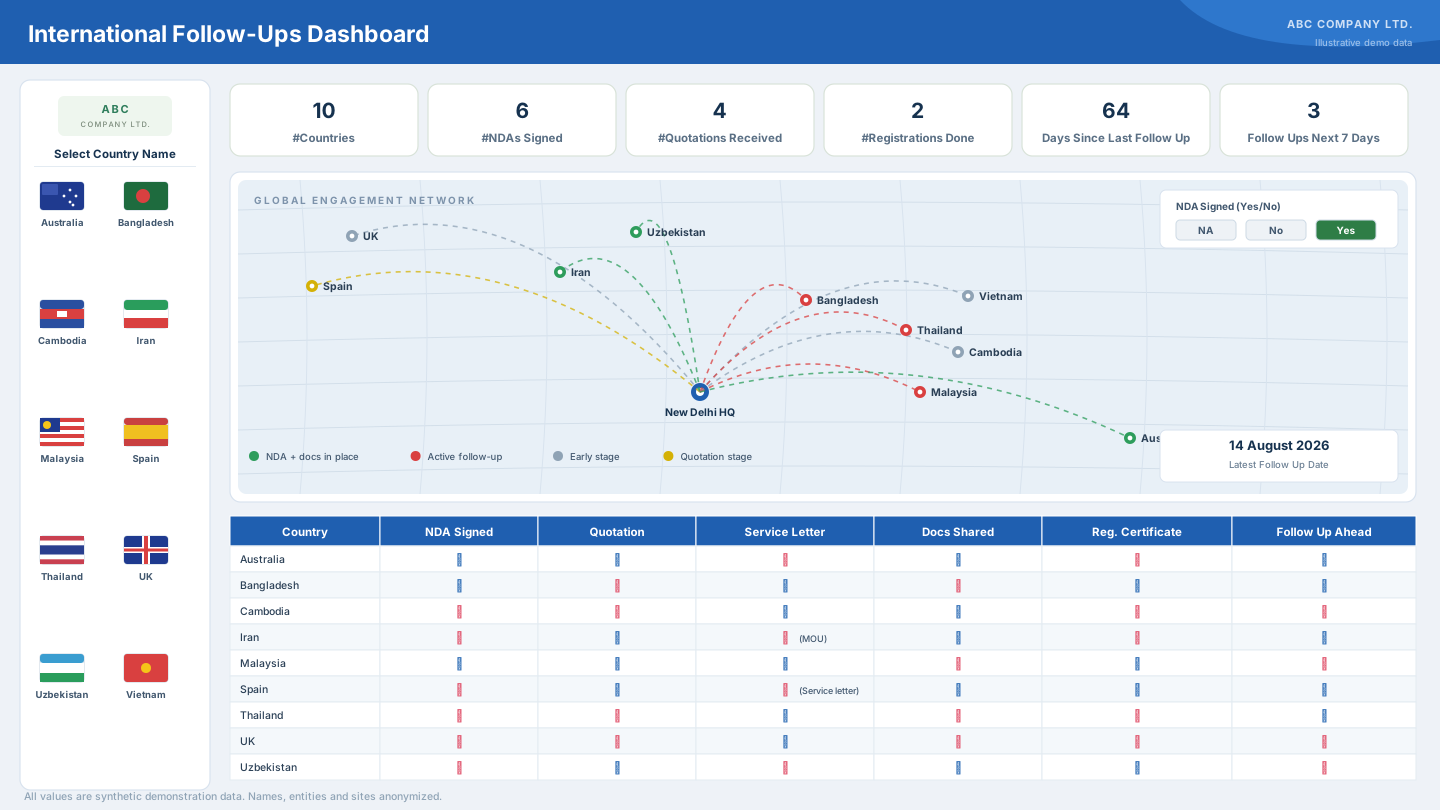
International Follow-Ups Dashboard
A compact Power BI tracker for international business development — NDAs, quotations, registrations and follow-up cadence across ten countries, on one screen.
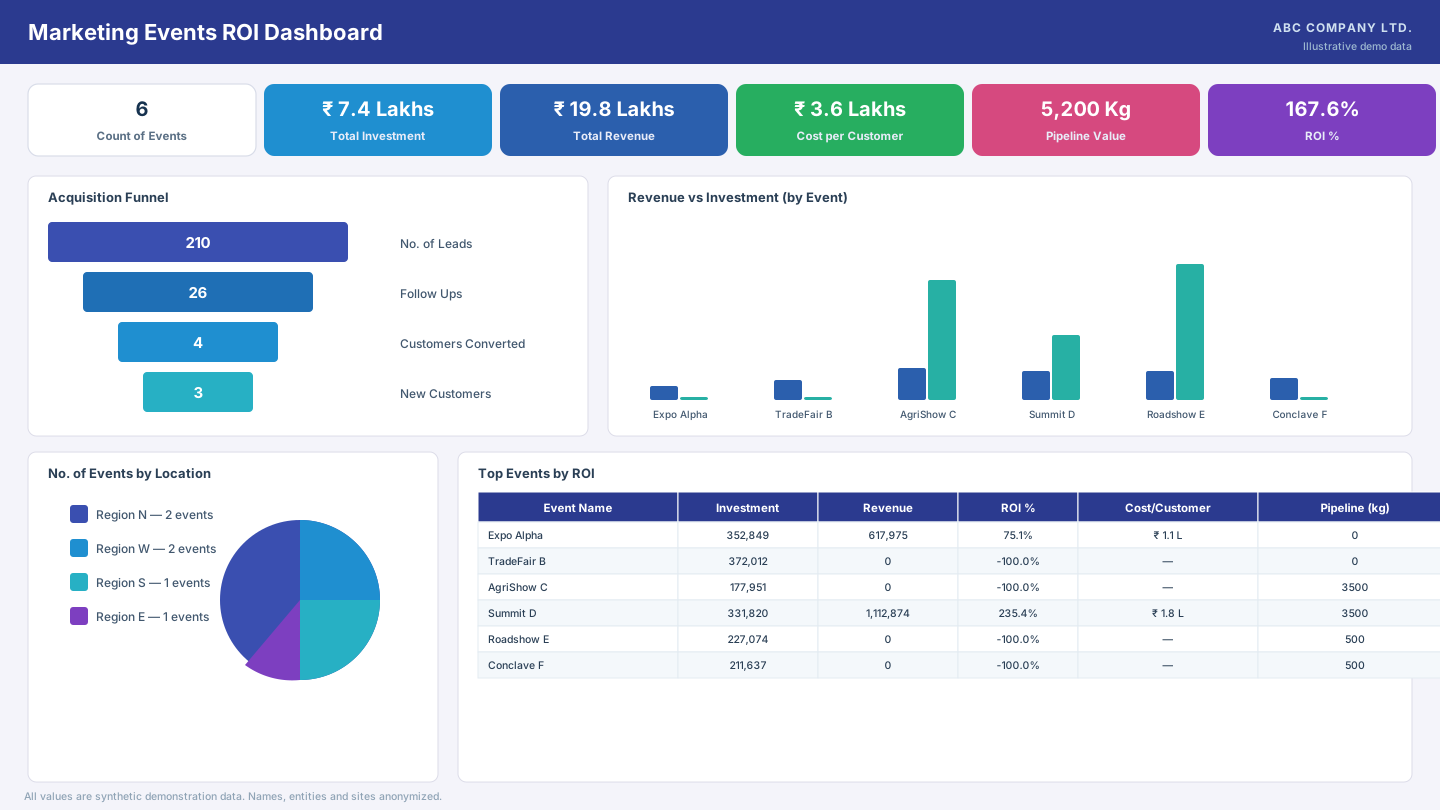
Marketing Events ROI Dashboard
A Power BI view that puts every marketing event on the same yardstick — investment, revenue attributed, cost per customer and pipeline — so the events calendar competes on evidence.
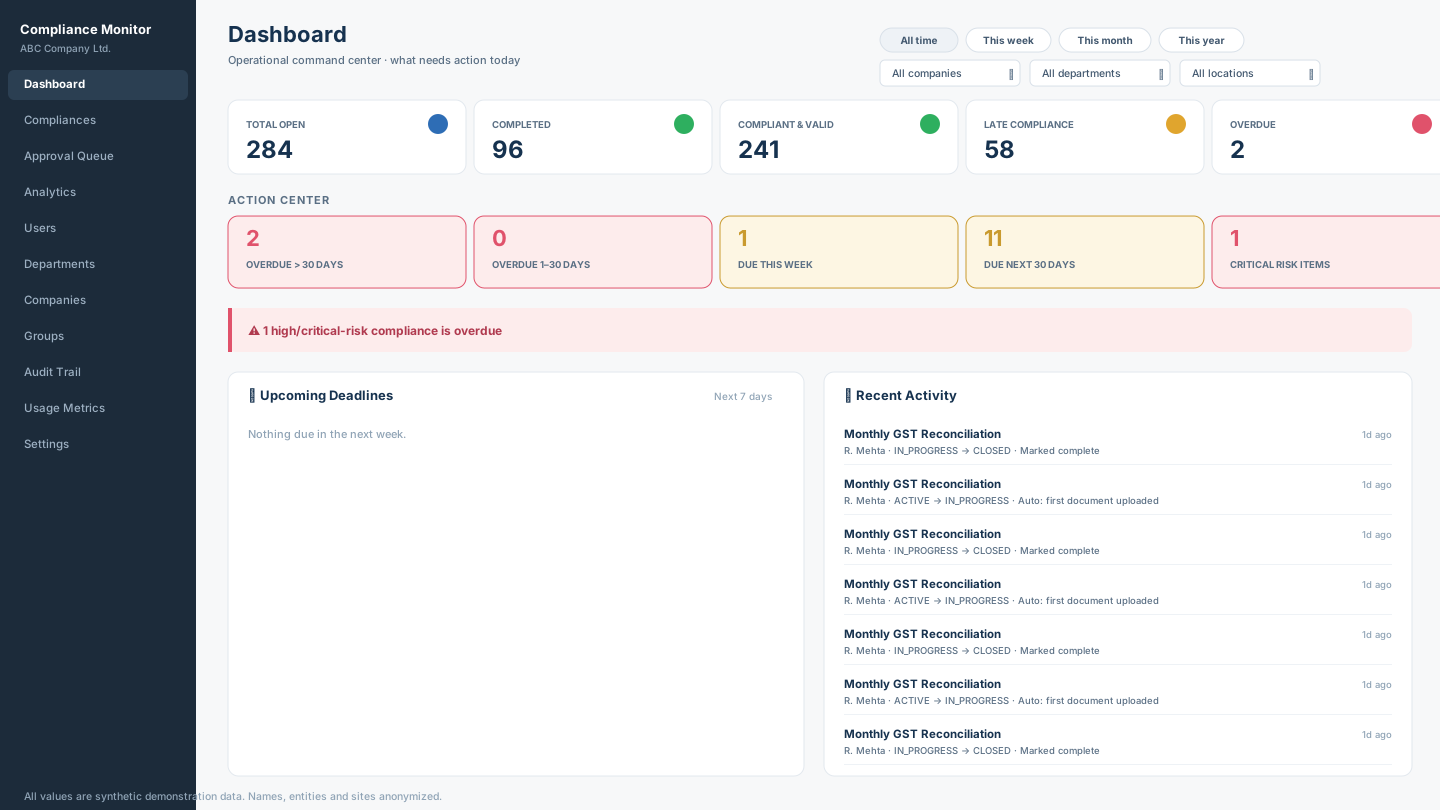
Enterprise Compliance Monitoring Platform
A centralized compliance monitoring platform — built using AI-assisted development and deployed on AWS — that replaced siloed, department-level spreadsheets with a single, standardized system supporting Compliance Owners, Compliance Monitors, and automated management reporting.
Business Insights Dashboard
A centralized Power BI decision-support tool giving leadership a single source of truth across Sales, Receivables, Inventory and Procurement — replacing fragmented, function-by-function Excel reporting.
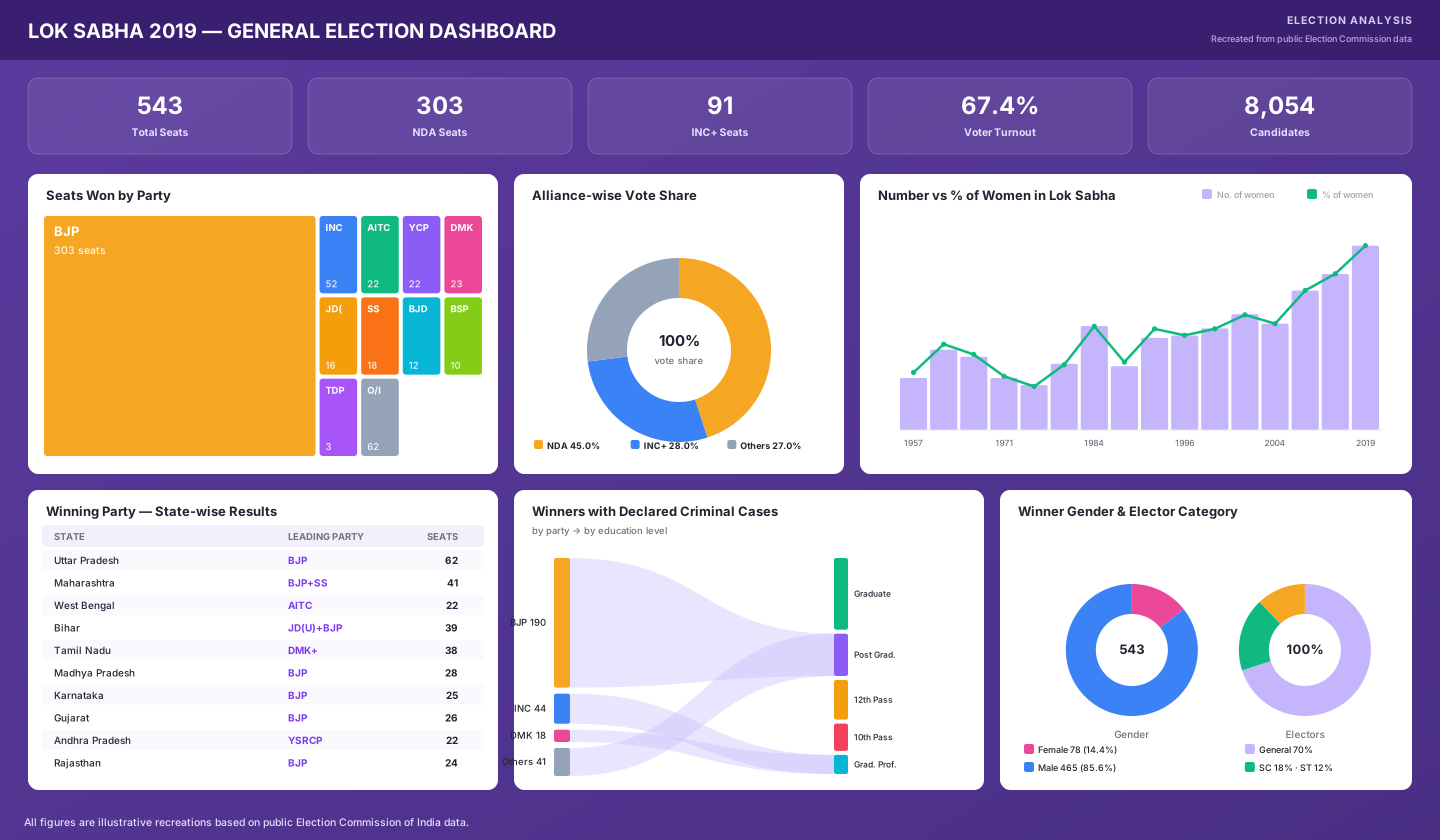
Lok Sabha 2019 Election Dashboard
A Power BI dashboard exploring the 2019 Indian general election — party and alliance seat distribution, voter turnout by zone, winner demographics and state-level results across 543 constituencies.
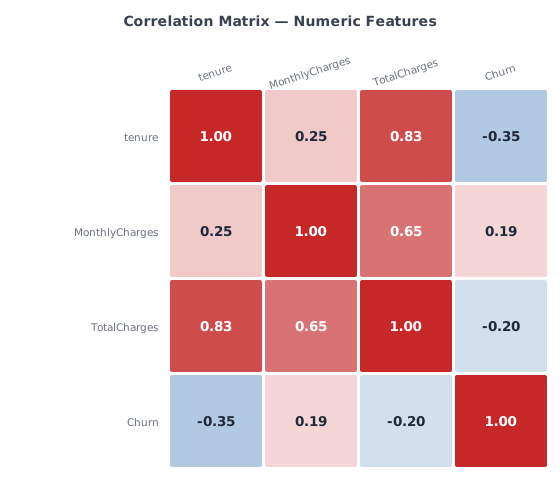
Customer Churn Analysis — IIFT Case Competition
A Python-based customer churn analysis built for the IIFT Samahva case competition — exploring churn drivers through EDA, feature relationships, and classification modelling on customer behavioural data.
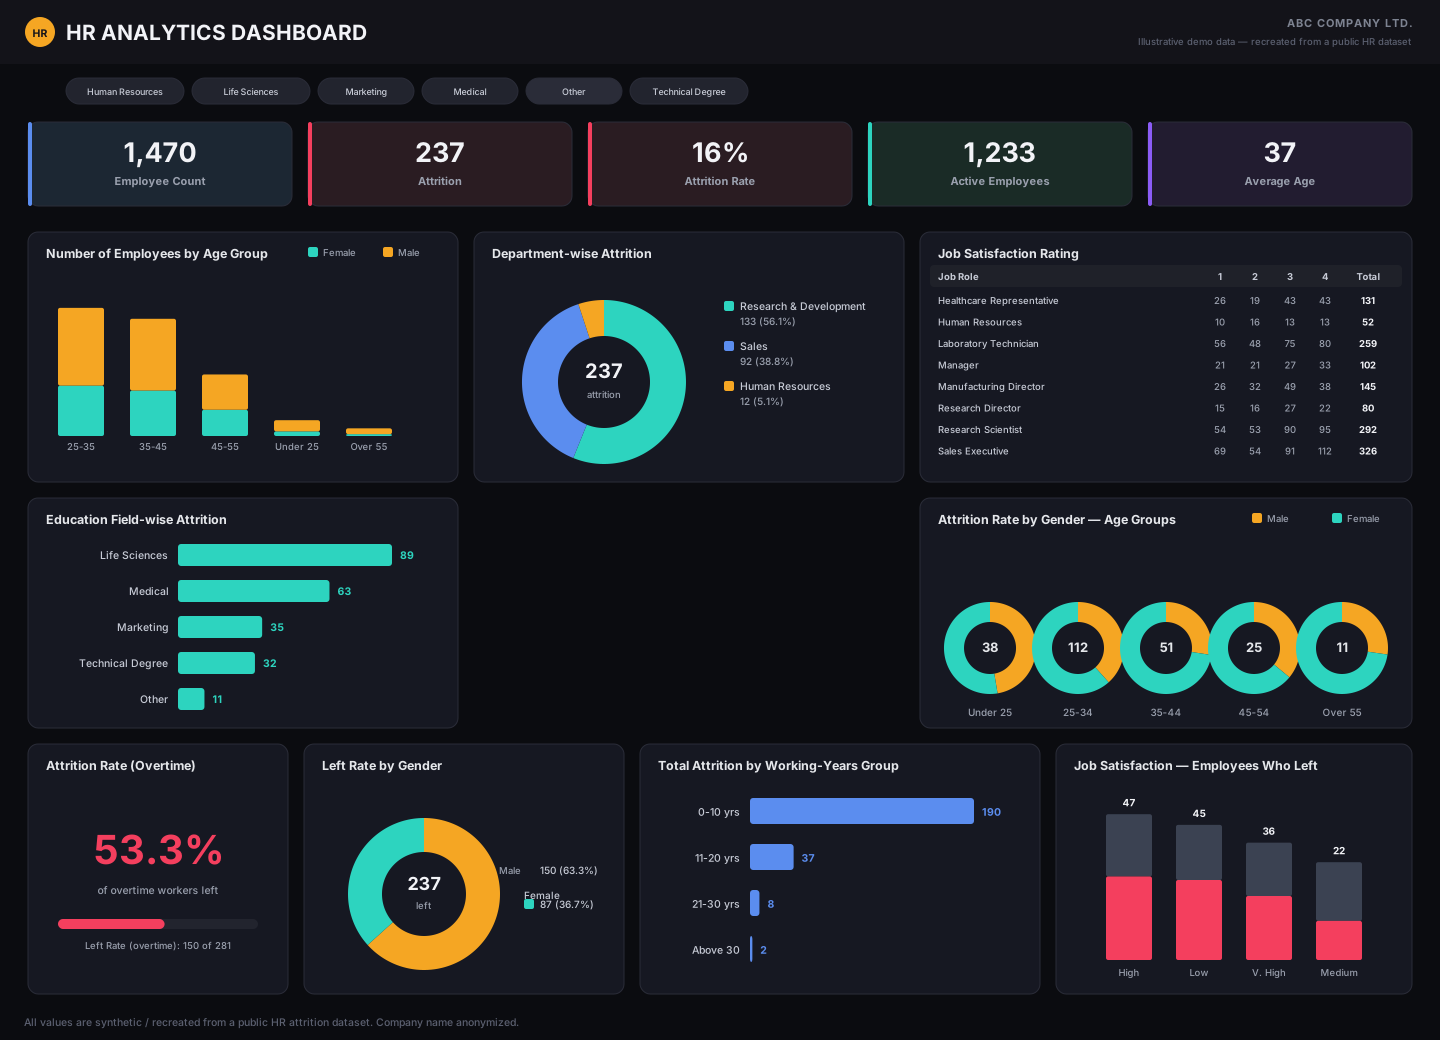
HR Analytics Dashboard — Employee Attrition
An interactive Power BI dashboard analysing employee attrition across a 1,470-person workforce — uncovering which departments, age groups, job roles and working conditions drive the highest departure rates.
Titanic Survival Prediction — Logistic Regression
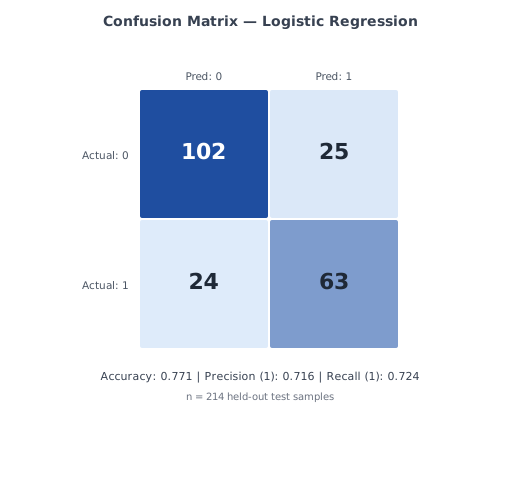
A Python logistic regression model on the Kaggle Titanic dataset — exploring which passenger features predicted survival, and achieving 77% test accuracy on a held-out test set.
Currently Building
A living body of work, not a finished portfolio
These are active initiatives — not yet published as full case studies.
Production Log Digitalization
Ongoing
Journals Consolidation Platform
In development
Automated ERP Alerts — Business Central
Live
Kario AI Assistant
Ongoing
Remote Sensing / Crop Intelligence
Ongoing
Field Marketing AI/BI Opportunity Mapping
In progress
Learning Now
Actively building toward deeper technical depth
Professional Presence
From my LinkedIn
Where I share what I'm building and learning, as it happens.
Feb 2023
Interactive HR Analytics Dashboard in Power BI
Employee attrition analysis end to end — Power Query columns, DAX measures, and the retention patterns across job role, age group, tenure and department.
Jan 2023
First Logistic Regression Model in Python — Titanic Dataset
A full statistical workflow with a teammate: data wrangling, train/test split, coefficients and a confusion matrix — landing at 77% test accuracy.