Marketing · Agri-processing / Manufacturing
Marketing Events ROI Dashboard
A Power BI view that puts every marketing event on the same yardstick — investment, revenue attributed, cost per customer and pipeline — so the events calendar competes on evidence.
- Status
- Live in production
- Published
- February 2026
- Reading time
- 2 min read
- Project type
- Analytics & BI
- Complexity
- Low
Every event measured on the same ROI yardstick
Comparability
Leads → follow-ups → conversions per event
Funnel view
Evidence base for next season's events calendar
Allocation
Business Question
Events consume real budget on gut feel — this exhibition "went well", that one "had footfall". The question this dashboard forces: per event, what was invested, what revenue and pipeline came back, and what did each converted customer actually cost?
Data Sources
Event-wise cost sheets, lead and follow-up records captured by the marketing team, and revenue attribution for converted customers, combined into a per-event model with location and date context.
KPIs
Investment and attributed revenue per event, ROI percentage, cost per converted customer, pipeline value, and the acquisition funnel — leads, follow-ups, conversions, new customers.
Dashboard Design
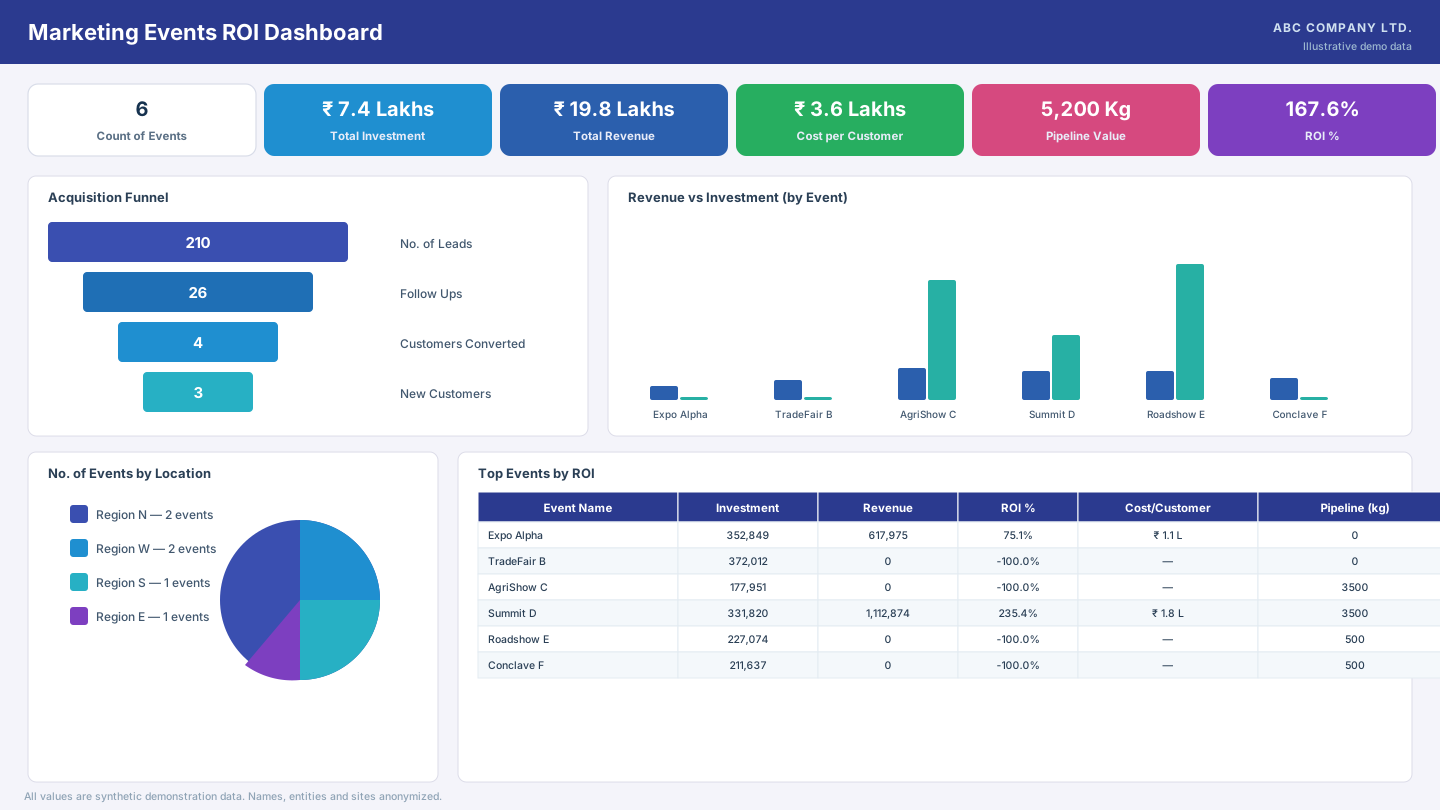
Headline KPI strip, the acquisition funnel, a revenue-vs-investment comparison by event, events by location, and a ranked ROI table — deliberately simple enough to settle a budget argument in one look.
The view below is a recreation with fully synthetic data.
Key Responsibilities
- Defining event ROI consistently with the marketing team — what counts as attributed revenue and pipeline
- Designing and building the Power BI view and its funnel and ROI measures
- Structuring event cost and lead capture so events are comparable
- Presenting the view in review discussions on event selection
Technologies I Personally Used
Analytics & BI
Data
Insights
Measured on one yardstick, events separated sharply — a small number delivered strong ROI while others produced leads that never converted. The funnel view exposed where each event lost momentum: some generated volume without follow-up capacity, others converted well from tiny lead counts.
Business Decisions
The ranked ROI table became the starting point for the next events calendar — which events to repeat, which to renegotiate or drop, and where follow-up capacity (not the event itself) was the real constraint.
Business Impact
Business impact is currently being quantified and will be updated as validated metrics become available. Qualitatively, event selection discussions now begin from measured ROI rather than impressions.
Lessons Learned
- Attribution rules matter more than the visuals — agree what "revenue from an event" means before building anything
- Funnel stages reveal more than ROI alone; the same ROI can hide opposite problems
- Negative-ROI events are the most valuable rows on the table — if the data is trusted
Reflection
What I learned: marketing analytics is diplomacy with numbers — the dashboard works because definitions were agreed before results appeared.
What I would improve today: longer attribution windows for slow-converting agricultural buying cycles.
Future enhancements: multi-season event comparisons and lead-quality scoring at capture time.
Related work
R&D & Marketing Intelligence
News & Tender Intelligence Portal
An internal intelligence portal that automates news and tender monitoring for R&D and Marketing, replacing fragmented manual searches with a centralized, keyword-driven workflow.
Field Operations & Supply Chain
Seaweed Digital Platform
A mobile-first field platform digitizing seaweed collection operations across 30+ coastal sites — offline-first collection capture, field hierarchy, species-wise targets and daily operational visibility. Vendor-developed; I own it functionally end to end.