Field Sales & Marketing · Agri-inputs / Rural distribution
Field Team Performance Dashboard
A per-officer Power BI dashboard for a large field sales organization — product-wise sales, market penetration, activity levels and rankings, designed so every field officer can self-monitor.
- Status
- Live in production
- Published
- April 2026
- Reading time
- 3 min read
- Project type
- Analytics & BI
- Complexity
- Medium
Per-officer views across a multi-state field organization
Coverage
Officers see their own sales, activity and ranking
Self-monitoring
One definition of performance across products and states
Standardization
Business Question
A field organization spread across states runs on individual effort — meetings held, retailers visited, kilometres travelled, orders booked. The question this dashboard answers for every officer: how am I actually doing, on which products, against which activity levels — and where do I stand?
Data Sources
Field activity reporting (meetings, visits, travel), sales and distribution data per product, retailer tagging, and cultivation-area reference data for penetration measures — combined into one per-officer model.
KPIs
Per product: current month and year sales, parties billed, repeat-order share, market penetration against area under cultivation, and stock position. Per officer: present/absent days, meetings per day, retailer and farmer meetings, kilometres travelled, orders booked, and an overall rank within the organization.
Dashboard Design
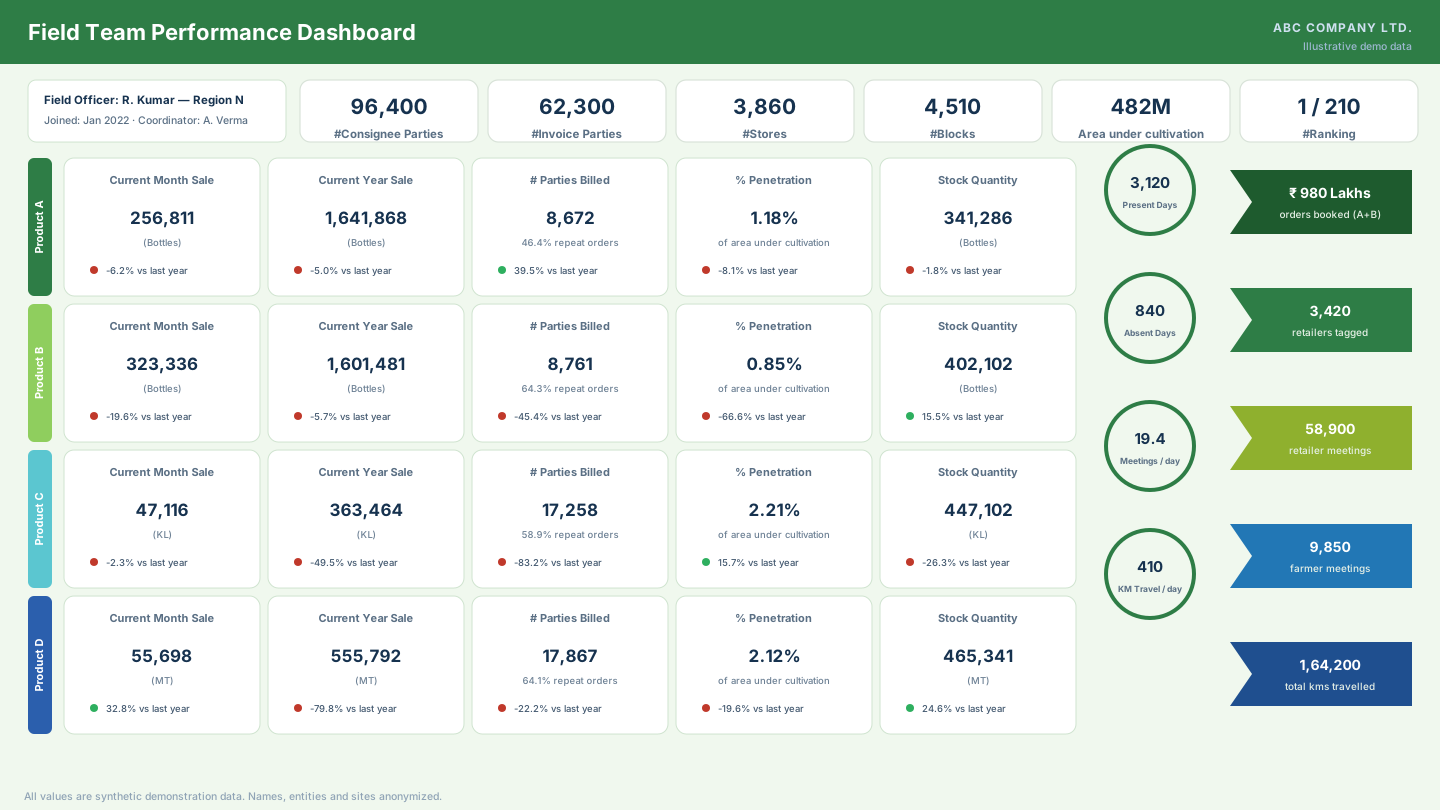
The dashboard opens on the officer's own profile — their region, tenure and headline rank — then lays out one row per product with sales, billing, penetration and stock cards, flanked by activity metrics.
The view below is a recreation with fully synthetic data — the officer name, region, coordinator and every value are randomized.
Key Responsibilities
- Designing the per-officer reporting structure with field leadership
- Building the Power BI model joining activity, sales and reference data
- Defining penetration, repeat-share and ranking measures in DAX
- Standardizing product-wise definitions so comparisons hold across states
- Supporting rollout so officers could use the view for self-monitoring
Technologies I Personally Used
Analytics & BI
Data
Insights
Putting activity and outcome on one screen surfaced the real patterns — officers with high meeting counts but low conversion, and the reverse; products where penetration lagged despite stock availability; and how much performance variation existed inside the same state.
Business Decisions
The ranking and per-product breakdowns gave field leadership a shared, neutral basis for reviews — and gave officers themselves a way to see their standing without waiting for a monthly meeting.
Business Impact
Business impact is currently being quantified and will be updated as validated metrics become available. Qualitatively, performance conversations across the field organization now start from one standardized view.
Lessons Learned
- Self-monitoring changes behaviour differently than top-down review — the same number lands differently when an officer finds it themselves
- Penetration measures are only trusted when the denominator (cultivation area) is visibly sourced
- Rankings need stable definitions; changing a measure mid-year breaks trust in the whole board
Reflection
What I learned: field analytics succeeds on fairness — every definition has to survive the question "is this the same for everyone?"
What I would improve today: add trend context to every card, so an officer sees direction, not just level.
Future enhancements: territory-level benchmarks, target-vs-actual overlays, and mobile-first layouts for use in the field itself.
Related work
R&D & Marketing Intelligence
News & Tender Intelligence Portal
An internal intelligence portal that automates news and tender monitoring for R&D and Marketing, replacing fragmented manual searches with a centralized, keyword-driven workflow.
Field Operations & Supply Chain
Seaweed Digital Platform
A mobile-first field platform digitizing seaweed collection operations across 30+ coastal sites — offline-first collection capture, field hierarchy, species-wise targets and daily operational visibility. Vendor-developed; I own it functionally end to end.