Data Analysis & Visualization · Learning project / Public data
Lok Sabha 2019 Election Dashboard
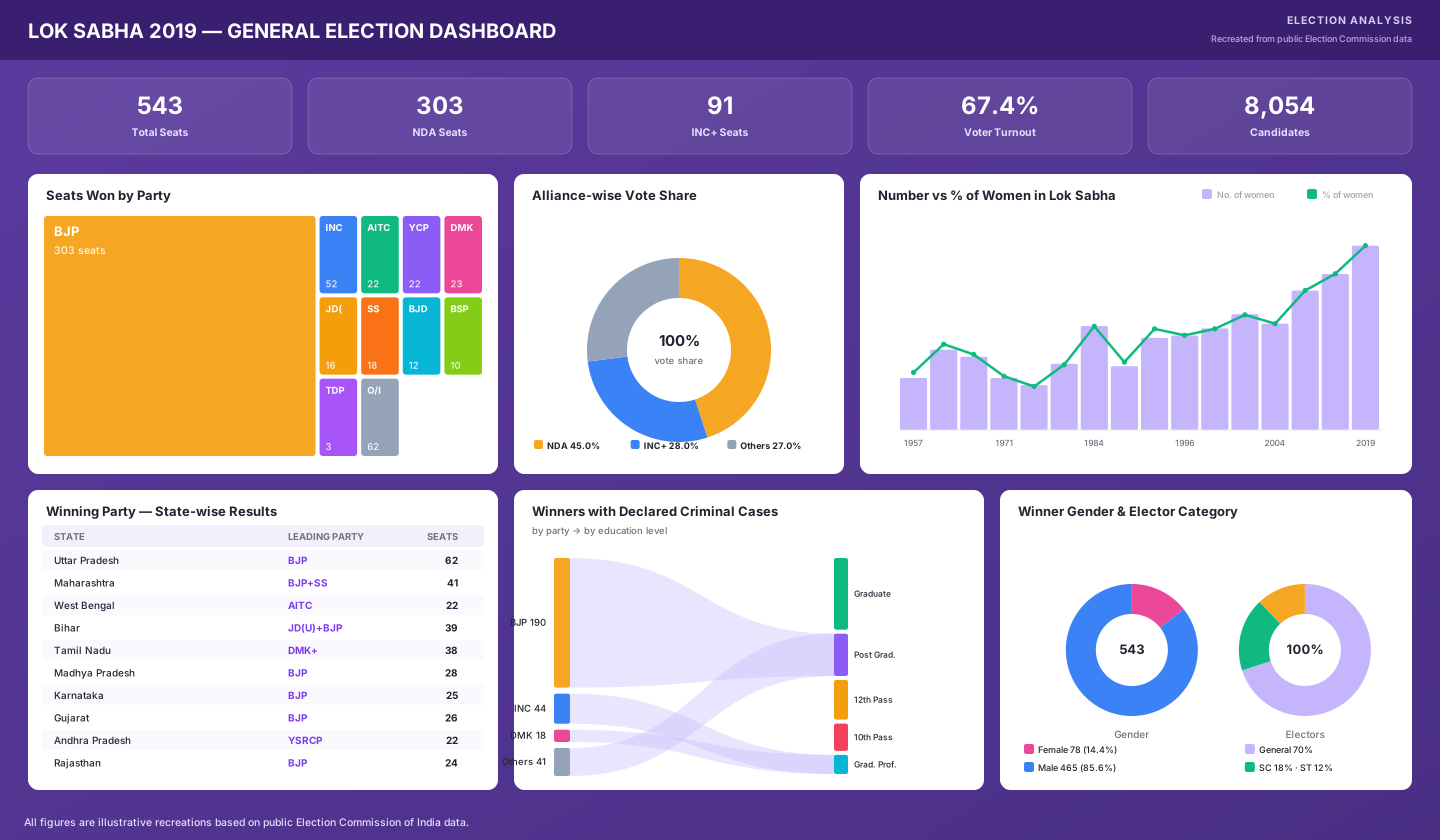
A Power BI dashboard exploring the 2019 Indian general election — party and alliance seat distribution, voter turnout by zone, winner demographics and state-level results across 543 constituencies.
- Status
- Published
- Published
- June 2023
- Reading time
- 3 min read
- Project type
- Analytics & BI
- Complexity
- Low
543 constituencies, 8,054 candidates, 613M votes
Dataset
Party seats, alliance share, turnout, winner demographics
Coverage
Built during SRCC-GBO as a data journalism and BI exercise
Context
Business Question
What does the 2019 Lok Sabha result actually look like across multiple dimensions — not just who won, but how voter turnout varied by region, what the winner demographics looked like, and where individual parties performed relative to their alliance?
Data Sources
Publicly available election data from the Election Commission of India covering all 543 parliamentary constituencies — candidate details, party affiliation, votes received, winner status, and supplementary data on winner demographics (age, gender, education, declared criminal cases).
KPIs
Total seats, seats won by alliance and party, voter turnout percentage (overall and by zone), total votes cast, gender and age distribution of winners, and education and criminal-record disclosure rates among elected candidates.
Dashboard Design
A multi-panel Power BI report with a summary KPI row, party-wise seat bars, alliance-share visualizations with vote share breakdown, zone-wise turnout columns, a state results table, and a winner demographics panel covering gender, age, education and declared criminal cases.
Key Responsibilities
- Sourcing and structuring the public election dataset for Power BI
- Building zone-level geographic aggregations in Power Query
- Designing the multi-panel layout balancing overview and detail
- Creating DAX measures for turnout rate, seat share, vote share and demographic breakdowns
Technologies I Personally Used
Analytics & BI
Data
Insights
- NDA won 303 of 543 seats — a clear majority; INC+ took 91; the remaining 149 went to regional parties and independents
- North-East zones showed the highest turnout at 78%+; Western India was lowest at 63%
- 85.6% of winners were male; 78 women won seats
- 43% of winners had declared criminal cases — a data point that generated discussion in the context of electoral reform
- Employees with 0–5 years tenure showed the highest attrition in the HR dashboard; analogously, constituencies with first-time incumbents showed higher variance in vote margins
Business Impact
This was a learning project. It was used as a portfolio piece during the SRCC-GBO programme, demonstrating the ability to work with large public datasets and extract multi-dimensional analytical views using Power BI.
Lessons Learned
- Large public datasets require significant cleaning — constituency name standardization and state boundary reconciliation took more time than the visualization itself
- Geographic aggregation (by zone) required building a reference table manually when the dataset didn't include it
- Demographic panels on winners added a layer of analysis not commonly seen in standard election coverage, which made the dashboard more interesting to viewers
Reflection
What I learned: working with a fully public, high-interest dataset forced precision — any number could be checked against public sources, which raised the bar for data validation.
What I would improve today: add an interactive map visual for the constituency-level result and a trend comparison with the 2014 election for seats and vote share movement.
Related work
R&D & Marketing Intelligence
News & Tender Intelligence Portal
An internal intelligence portal that automates news and tender monitoring for R&D and Marketing, replacing fragmented manual searches with a centralized, keyword-driven workflow.
Field Operations & Supply Chain
Seaweed Digital Platform
A mobile-first field platform digitizing seaweed collection operations across 30+ coastal sites — offline-first collection capture, field hierarchy, species-wise targets and daily operational visibility. Vendor-developed; I own it functionally end to end.